With the pandemic in the rearview mirror, return-to-office mandates are on the rise. Many workplaces don’t ask employees to show up every day from nine to five, and instead opt for a hybrid model of two to four days a week. Placer.ai noted that this “new hybrid status quo is already presenting cities, Business Improvement Districts, retailers, dining concepts and commercial real estate firms with significant challenges” due to an increase in office visits since initial closures plateauing recently as virtual work has had an impact on many workers. To better understand worker visitation patterns across major U.S cities such as Boston MA; Chicago IL; Houston TX; New York NY and San Francisco CA., Placer collected employee data showcased in their white paper entitled “Exploring the On-Site Workforce in 5 Major U.S Cities .”
The data indicated that employee traffic was heavier during midweek while top executives accounted for disproportionate share of visits demonstrating they were leading by example – proximity also played its part with close one quarter of all visits coming from areas less than a mile away from business centers depending on public transportation or parking space availability respectively – one person households had more frequent attendance too while other takeaways included workplace visitation patterns varying across professional sectors and ease of access being important factors when considering returning back into offices post pandemic.. Senior Vice President Marketing Ethan Chernofsky noted employers are focusing on how make offices appealing again through amenities within buildings or experiences around them attempting offset some impacts virtual work may have caused – ripple effects lower workplace attendance impacting food trucks stores hotels subway systems etc..

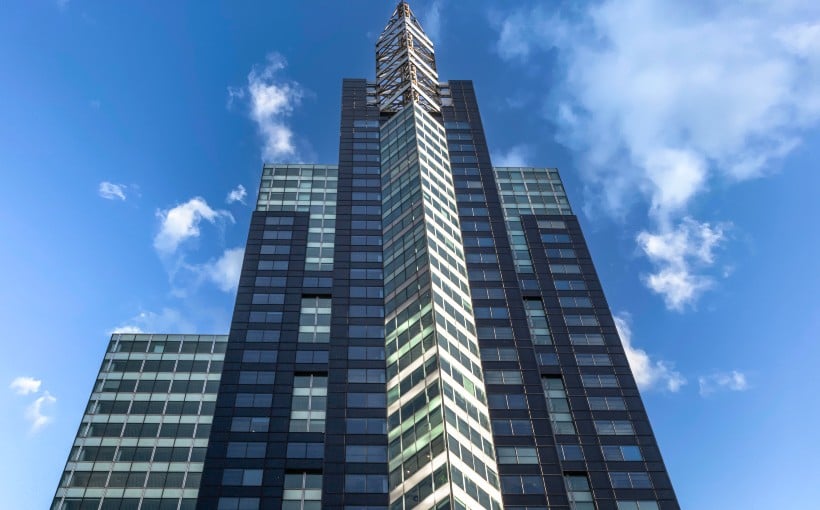
Pandora Jewelry and Woori Bank Sign 74K SF of Long-Term Office Leases at 1540 Broadway
GFP Real Estate and BDT & MSD Partners have secured more than 74,000 square feet of new long-term office leases